Results
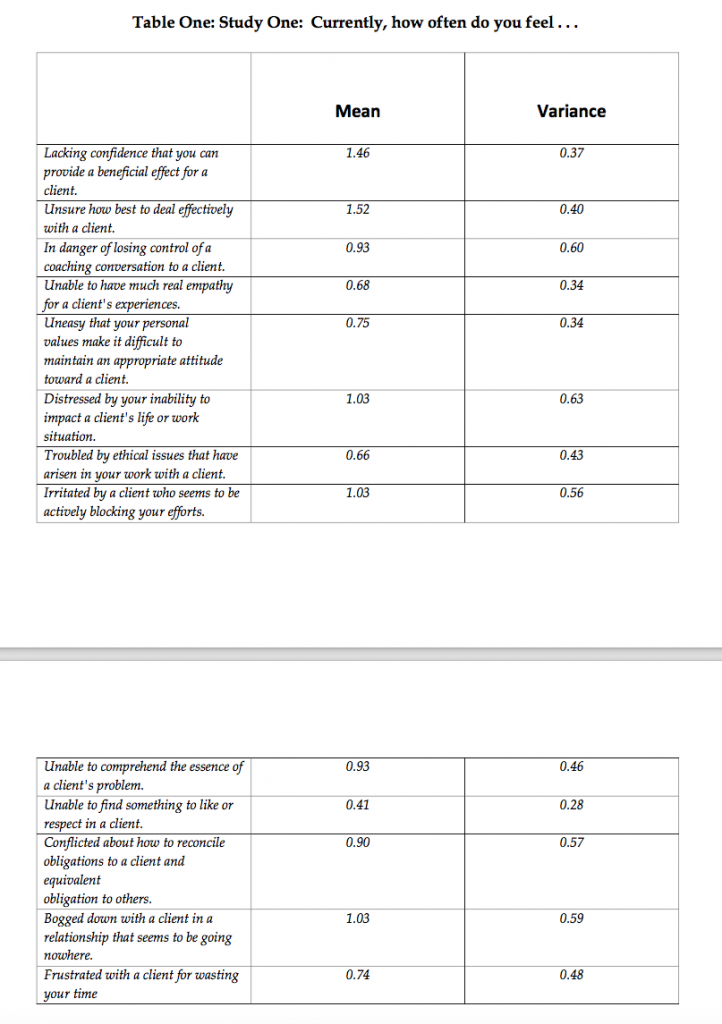
As we did in the first report we will offer only basic descriptive statistics (mean and variance) for all of the statements associated with each of these three questions. The mean scores will give us an initial impression regarding the extent to which respondents rated themselves low or high on each item, while the variance scores will give us an initial impression of the extent to which respondents tend to agree with one another in their rating of each item.
Question One: Currently, how often do you feel . . .
We begin by providing a summary of the responses to this initial question concerning how coaches feel about various aspects of their work as a coach.
First, a table for the first study with mean scores and variance for each item:


Rey Carr
December 17, 2015 at 4:00 pm
The best part of this report of the results of these two surveys is the discussion of the concepts. Such discussion is valuable regardless of the reliability or validity of the results (or evidence).
Unfortunately, the methodology section is missing the most important aspect of methodology: how were each of the surveys distributed and what was the rate of return. If, as I suspect, this was an Internet-based survey, then the results have an exceptionally low chance of being either reliable or valid. That is, the likelihood that they reflect the “coaching industry” or “a typical coach” is incredibly small. Thus, conclusions based on the results are suspect.
But there’s the point. The discussion itself has its own reliability and validity independent of the survey. The points made are worthy of continuing discussion regardless of the surveys.