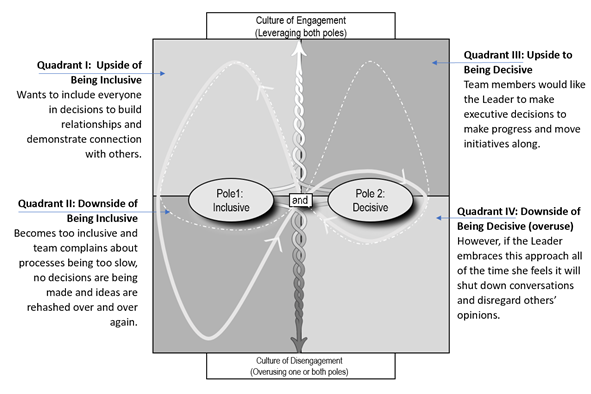
The coach then reveals one of the PolarityMaps™ (Figure 1) in the assessment around feeling Connected to illustrate the Leader’s thought process. A PolarityMap™ is a sense-making tool created by Dr. Barry Johnson (Polarity Management, 1992), that coaches can use to help leaders see the relationships between behaviors as well as the greater system in which they are operating. In this map, the two poles are “Inclusive” and “Decisive.” The solid white infinity loop indicates the average of the scores in which her colleagues rated her in four quadrants. The dotted line indicates an ideal rating that would maximize a leader’s potential. The first quadrant represents how well the Leader demonstrates being Inclusive—leading to an increase in engagement. The second quadrant is how much the Leader overfocuses on being Inclusive, which has a negative effect on engagement. The third quadrant is how well the Leader demonstrates being Decisive; this also leads to an increase in engagement. And the fourth quadrant is how much the Leader overfocuses on being Decisive, resulting in a negative effect on engagement. Lastly, the spiral pointing up in the middle of the map represents one’s full potential when leveraging the upsides of both poles. Similarly, the downward facing spiral leads to a vicious cycle of the downsides of one or both poles resulting in disengagement.
Figure 1
Sample PolarityMap®


